Node Inspector
Node Inspector allows you to debug your app using a nice GUI debug interface inside of a browser. It currently only works in Chrome and Opera. If you’re familiar with the Chrome Developer Tools, Node Inspector will look familiar to you: the interface is identical.
[~/javascript/node.js/debugging/debugger(master)]$ cat example.js
for(var i=0; i<5; i++){
  console.log(i);
}
console.log("done");
To use Node Inspector to debug, you’ll need to install it from NPM via:
[~/javascript/node.js/debugging/debugger(master)]$ npm install -g node-inspector
Once installed, we can use it to run our Node app by typing:
[~/javascript/node.js/debugging/debugger(master)]$ node-debug example.js
You should see output that looks something like this:
Node Inspector v0.12.7
Visit http://127.0.0.1:8080/?port=5858 to start debugging.
Debugging `example.js`

Debugger listening on port 5858
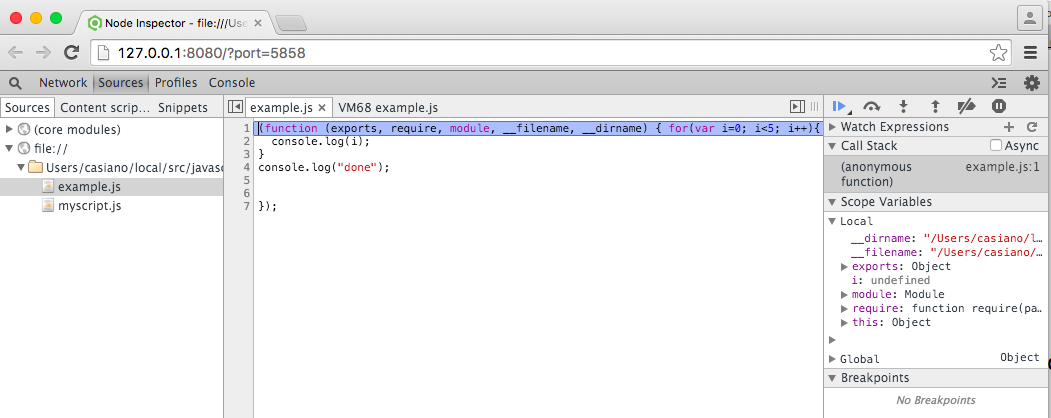
You can browse your source code and set breakpoints just as you would when debugging client-side JavaScript.